#72: Managing the "End" of a Data Pipeline
Jul 10, 2024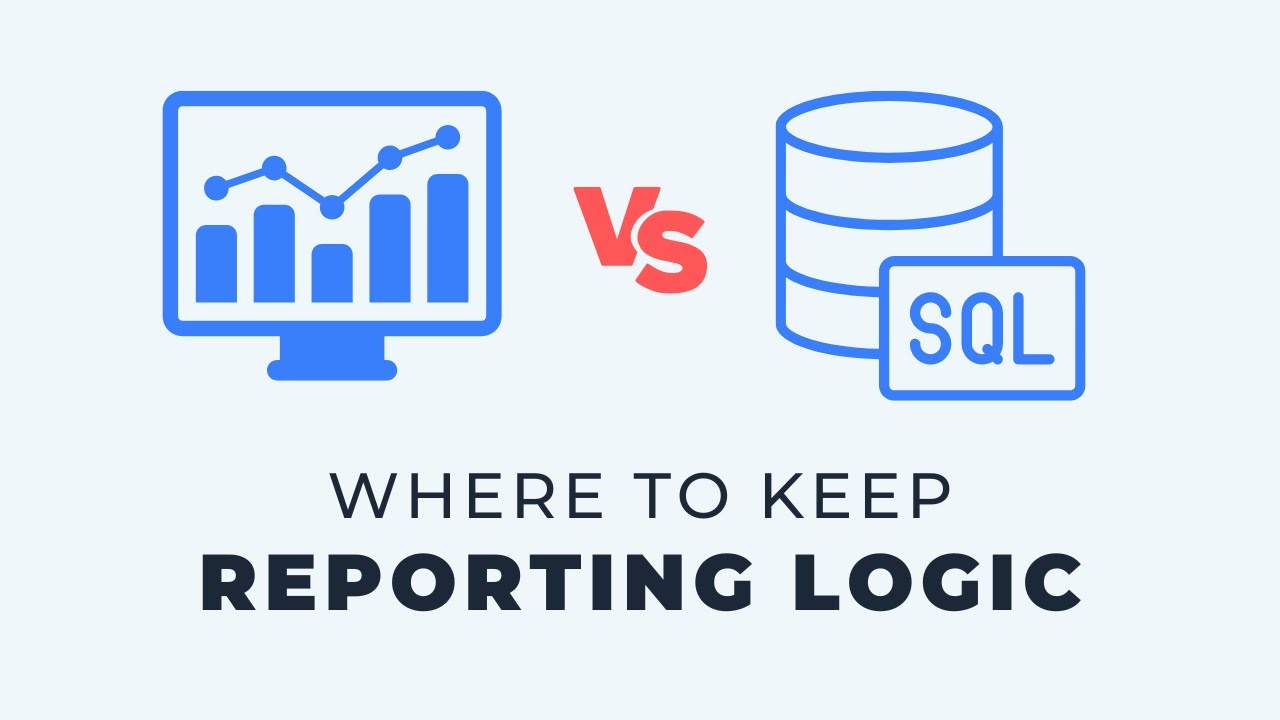
If there is such a thing as the end of a data pipeline, it is usually a report in the hands of a stakeholder. Building one is never a clean handoff, so the real question is where the inevitable changes get made: inside the reporting tool, or in the transformation code behind it. My answer is the transformation layer, for three reasons. You keep visibility, because the logic sits in version control with the rest of the project instead of buried in a dashboard. You keep consistency, because changes run through the same development, testing and review workflow every time. And you keep control, because the precedent you set decides whether a metric has one definition or five.
Key takeaways
- The end of a pipeline is a report, and reports generate change requests forever. Decide up front where those changes get made.
- Logic in the transformation layer is tracked line by line: what changed, when, and who changed it.
- Logic in a reporting tool is usually stored separately, if at all, and it sits outside the workflow the rest of the project uses.
- Inside a BI tool, logic hides in several places at once: custom models, custom datasets, column level calculations on top of those.
- The database gives you a real workflow: develop, test, review, promote to production. A reporting tool rarely gives you all four.
- The hardest problem is not technical. Once anyone can change logic in a dashboard, you get conflicting numbers under the same metric name.
- Use every feature your reporting tool has for analysis and presentation. Just do not let it become where the definitions live.
The two schools of thought
A report gets delivered and the conversation starts. Add a column, change this calculation, can it also show last year. That is normal, and it never stops.
There are two places to absorb those requests:
- Change the report. Open the reporting tool, add the calculation there, publish. Fast, and no one else has to be involved.
- Change the code. Make the change in the transformation layer in the database, and let the report pick it up.
Both work. The difference is what each one costs you six months later, which is what the rest of this comes down to.
Reason 1: Visibility
By the time something reaches a report, it has usually been through several layers of transformation. Where that logic is stored decides whether anyone can find it again.
Version control on one side only
If you are using a tool like dbt, or Data Factory, or anything else backed by a shared repository, your transformation code is versioned. You can track changes line by line: what changed, when, and who made the change.
Once you get to the report, that usually stops. The report is stored somewhere else, if it is stored at all.
Some visualization tools do have code based workflows. The general case though, Tableau, Power BI, Looker, is a version control story that is separate from and inconsistent with the rest of the project.
Logic ends up in too many places
The part that really costs you is scatter. Inside a reporting tool, logic can live in several layers at once.
- A custom model or dataset built for one report, or shared across a few
- Column level calculations layered on top of that model
- Filters and parameters that quietly change what a number means
These are great features, and you should use them. But if the goal is a robust and consistent architecture, logic spread across all three leads to confusion about where anything actually happens.
The question that exposes it
Think about the most common question you get: what does this column mean?
It sounds simple. If the logic is spread through a reporting tool, answering it means opening a custom dataset, then a few custom columns, then working out which one won.
If it is in the database, it should fit a consistent pattern and you can point at exactly where it is defined. Some tools even give you lineage to trace a specific column back through the model.
That does not make tracking logic effortless. It does mean you look in one place instead of several.
Reason 2: Consistency
The second reason follows from the first, and it is mostly about workflow.
Say you want to add a column or change how something is calculated. In the visualization tool you can do it quickly, which is genuinely useful.
But there is no good way to test it, other than maybe building a separate report, which lives outside where the rest of the code is anyway.
What the database workflow gives you
Make the same change in the transformation layer and you get the full process:
- Version control, line by line, with history
- Tests that run objectively before the change reaches production
- Environments, so you build in development and promote to production
- Review, where a teammate reads the change and gives feedback
- Automation, so all of that happens the same way every time
Together that process is what makes the data better. It also means the next person who opens the code finds a consistent pattern rather than a one off.
Queries written in a visualization tool are much harder to keep consistent than queries written in a transformation tool. The two exist for different purposes. They work together well, and in my opinion they should not replace each other.
Reason 3: Control
The third reason is about the human side rather than the technical justification.
When you set the precedent that logic changes can be made in the visualization tool, without going through the data team or the transformation pipeline, you lose the ability to agree on any process at all.
What that looks like in practice
You end up with analysts working in isolation, each adding their own logic because it is quick and it solves their problem. Nobody is being malicious. It is just the path of least resistance.
The secondary problem is the expensive one. Two reports show the same metric name with different meanings, and nobody can say which is correct.
So which one is the source of truth? Establishing consistent metrics is one of the most important things a data team does, and it is a simple idea that turns out to be very complex in practice.
It gets hard precisely because the floodgates were opened earlier, and the core logic the business should be using drifted away from the data team.
Why it is still the right call
I understand this is not always what people want to hear. Telling an analyst to route a change through the pipeline is slower on the day.
Over any longer horizon it is better for you, for the stakeholders and for the business, because you can actually be consistent about what you are presenting and explain why.
Most reporting tools are full of excellent features, and your data team should use them to build great analytical products. As a team lead, especially on a small team, the thing you have to hold onto is the logic.
Key terms
Transformation layer
The code in your database or warehouse, often a dbt project, where raw data is turned into the models reports read from.
Report layer logic
Calculations and transformations defined inside a visualization tool rather than in the database, which sit outside the project's version control and workflow.
Custom model
A dataset built inside a reporting tool to serve one or more reports, typically carrying its own joins and calculated fields.
Data lineage
The traceable path a column takes from source through each transformation to the report, which is what lets you answer where a number came from.
Single source of truth
One agreed definition of a metric that every report inherits, instead of several similar definitions with the same name.
Common questions
Should business logic live in the data warehouse or the BI tool?
Put shared logic, anything that defines a metric or a business rule, in the warehouse. Leave presentation choices, formatting and interaction in the BI tool. That split keeps definitions in one versioned place while still letting analysts build freely on top.
What about calculations that only one report needs?
A genuinely report specific calculation is fine in the reporting tool. The test is whether anyone else could reasonably ask the same question. If two reports would want it, it belongs in the transformation layer before the second one is built.
Is it slower to make changes in the database?
On a single change, yes. Across a year it is faster, because changes are tested, reviewed and reusable rather than re implemented in each new report. The speed you give up is mostly the speed of creating future rework.
How do I stop analysts from adding their own logic in dashboards?
Mostly by making the alternative easy. Give them well modeled tables that answer their questions, a clear way to request a change, and a short turnaround on it. Policy alone does not hold if the supported path is slower than the workaround.
Does this apply if my BI tool has version control?
It helps, but the logic is still versioned separately from the rest of the project, with its own workflow and its own review process. One pipeline with one history is easier to reason about than two systems you have to reconcile.
Related reading
- The True Value of a Data Presentation Layer
- How to Create a 3 Layer Data Model Pipeline
- Fix Your Data Pipeline...From The Start
- How to Build Modern Data Architectures Faster
Final takeaway
Every team I have worked with that lost trust in its numbers lost it at the report layer, one quick calculation at a time. Keep the definitions in the transformation layer and let the reporting tool do what it is good at, which is presenting them.
Additional Free Resources
Starter Guides & Checklists
Explore additional free resources built on the same patterns I use with real clients so you can build your own with structure and confidence. Topics include data architecture, modeling and more specifically for small data teams.