Data Modeling Crash Course: The 3 Layered Model
Nov 04, 2026
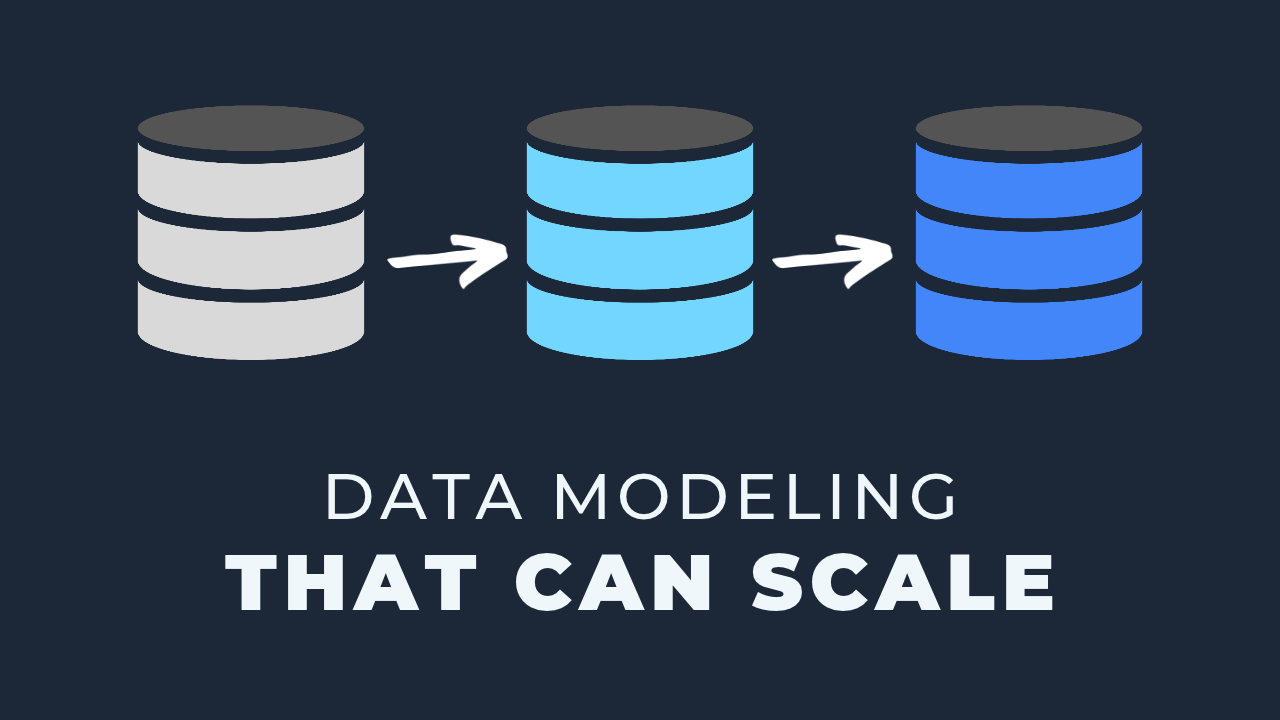
A three layer data model organizes a data pipeline into staging, warehouse, and marts. Staging is a one-to-one view on top of each raw source table, where renaming, light formatting, and cleanup happen once instead of getting repeated everywhere that source gets used. The warehouse layer is where the actual data model gets built, typically a star schema of fact tables holding business actions and metrics, connected through keys to dimension tables holding the descriptive context. Marts is the presentation layer, a final set of tables built from the warehouse and organized around what each business unit actually needs, connected directly to reporting.
Key takeaways
- A data team that feels like it's always starting from scratch usually has no structure behind its pipeline, not too little effort.
- Staging views are one-to-one with a source table and never contain joins, so a rename or a rounding rule only has to change in one place.
- A fact table holds the core business action and its metrics. A dimension holds the description around it, like a customer, a product, or a location.
- The same dimension, like customers, gets reused across multiple fact tables. That's a conformed dimension, and it's common, not rare.
- A junk dimension holds one-off descriptive values that aren't worth building a full dimension table around.
- Plan a data model backward from the report you actually need, then build it forward from source to staging to warehouse to marts.
- Start with one deliverable and a handful of models. The warehouse keeps growing from there, it's never a one-time build.
Why a long-term structure beats quick wins
Your work as a data team gets judged by how fast and how accurately insights get back to the business. The stakeholders asking for that work aren't concerned with how complicated the process is behind the scenes, and that's fair. It's not their job to be.
But that doesn't mean you can skip setting up a long-term structure in favor of quick wins that appease people in the short term. Short-term thinking makes it harder to build something that scales, and it leaves you feeling like you're starting from scratch with every new request. I hear that from teams constantly.
The fix is a well-organized data model sitting at the center of your work. Each new request builds on the existing structure instead of starting over, which makes the next request easier, which means you can take on more of them. That's the flywheel. It takes time up front to set up, but it's the thing that compounds.
The three layers: staging, warehouse, marts
The model breaks into three layers, each one a separate schema in your database. Data moves through them in order: staging, then warehouse, then marts. Each layer has a specific job, and keeping them separate is what makes the whole thing maintainable.
What the staging layer does
Why staging views are one-to-one, no joins
Staging objects are one-to-one views on top of the source tables you care about. They're views, not tables, so you're not duplicating storage. Think of a staging view as a cleaned-up layer sitting directly on top of the raw data: renaming columns, rounding numbers, casting dates, maybe flattening a JSON field.
The reason this matters is the same source table often gets used in five or ten different places downstream. Without staging, you repeat the same renaming and formatting logic in every one of those places. With staging, you do it once. If you ever need to change a rounding rule from two decimals to three, you change it in one view and it flows through everywhere that view gets referenced.
A staging view never contains a join. If you find yourself making a change that's one-to-one with a single table later in your pipeline, that's usually a sign it belongs back in staging.
Staging naming convention
The convention is stg_<source>__<table>. The stg prefix tells you immediately it's a one-to-one view with light transformations and no joins. The source name groups related views together and keeps them sorted in your schema browser. The table name tells you exactly which source table it represents.
-- stg_crm__customers.sql
select
    customer_id,
    upper(first_name) as first_name,
    round(lifetime_value, 2) as lifetime_value,
    created_at::date as created_at
from {{ source('crm', 'customers') }}
Just from the model name, you know it's staging, you know the source, and you know the table. No mental overhead to figure out what you're looking at.
How the warehouse layer turns staging into facts and dimensions
The warehouse layer is where the real data modeling happens, usually a star schema of fact and dimension tables. It's a shift for a lot of teams, because you're no longer pulling from raw sources. You're building on top of staging.
What a fact table holds
A fact table represents a business action, a verb: a sale happened, a game was played, an invoice was sent. It holds the measures you'll aggregate, like revenue or quantity, plus the keys to its related dimensions. A junk dimension, a few one-off descriptive values that don't deserve a full dimension table of their own, can live here too.
What a dimension holds
A dimension is the context around the action, nouns and adjectives: who the customer was, what the product was, where it happened. Think of dimensions as the filters and columns you'd expect on a report. Some dimensions change slowly over time, like an employee's home office. Deciding whether to overwrite that value or track it historically is what a slowly changing dimension strategy handles.
-- fct_games.sql
select
    game_id,
    team_id,
    opponent_team_id,
    points_scored,
    point_differential,
    case when point_differential > 0 then 1 else 0 end as is_win
from {{ ref('stg_sports__games') }}

-- dim_teams.sql
select
    team_id,
    team_name,
    college_name,
    conference
from {{ ref('stg_sports__teams') }}
Connect the fact to its dimensions through keys instead of storing the descriptive values directly in the fact table. The diagram of a fact table surrounded by its dimensions is why it's called a star schema.
Conformed dimensions
Building one fact table isn't the end of the model, it's the start of an expanding web of tables. A dimension built for one fact table, like customers, gets reused by other fact tables too. That's a conformed dimension, and it's the normal case, not an exception. As a rule of thumb, avoid joining facts directly to other facts.
What the marts layer is for
Marts is the presentation layer, the tables that actually get connected to reports. This is where you join warehouse tables together in whatever shape a given report or dataset needs. It's also where you can split schemas by department or permission level, so accounting sees certain tables and operations sees others, without anyone touching the warehouse directly.
Mart tables don't need the fact and dimension naming convention. That convention is useful internally, for your own organization. Once data reaches marts, name things in terms the business already understands.
Plan backward, build forward
Build the pipeline left to right: source, staging, warehouse, marts. But plan it right to left. Start with the deliverable you actually need, a report or a data feed the business cares about. Work backward to the columns and metrics that deliverable requires, then the core business action driving it, then the context around that action, then the source tables and staging models needed to get there.
Loading every available source just because it's there leads to a warehouse full of tables nobody uses. Start with one deliverable, build the handful of models it actually needs, and grow the warehouse from there. It's never a one-time build. You keep adding to it as new requests come in.
Key terms
Staging
A one-to-one view on top of a raw source table, used for renaming, light formatting, and cleanup. No joins.
Fact table
A table representing a business action, holding its metrics and the keys to its related dimensions.
Dimension
The descriptive context around a fact, like a customer, a product, or a location.
Star schema
A fact table connected to its dimensions through keys, named for the shape it makes in a diagram.
Conformed dimension
A single dimension, like customers, reused across more than one fact table instead of rebuilt for each.
Common questions
What is the staging, warehouse, marts data model?
It's a three layer approach to organizing a dbt pipeline. Staging cleans up raw source data in one-to-one views, warehouse builds the fact and dimension model, and marts presents the final tables that reports connect to.
Why use views instead of tables for staging?
Views avoid duplicating storage for a one-to-one copy of a source table, and they let a single change to renaming or formatting logic flow through everywhere that staging model gets referenced.
What's the difference between a fact table and a dimension?
A fact table holds a business action and its metrics. A dimension holds the descriptive context around that action, like who was involved or where it happened.
Do I need to build the entire warehouse before I can use it?
No. Start with one deliverable and the models it needs, then keep adding fact and dimension tables as new requests come in. The warehouse is never finished.
Why does the marts layer use different names than facts and dimensions?
Fact and dimension naming is useful internally, for the data team's own organization. Once data reaches marts, it's named in terms the business already understands.
Related reading
- How to Create a 3 Layer Data Model Pipeline
- Why Bother With Naming Conventions?
- Do You Need a Date Dimension?
- The Struggle of Data Modeling (Facts vs Dimensions)
Final takeaway
Every client project I take on starts with the same question: is there a structure here that can scale, or is every request getting handled from scratch? Staging, warehouse, and marts, built in that order and named consistently, is what makes the answer yes.
Additional Free Resources
Starter Guides & Checklists
Explore additional free resources built on the same patterns I use with real clients so you can build your own with structure and confidence. Topics include data architecture, modeling and more specifically for small data teams.